
Achieving a Perfect Lighthouse Score: Why It's Just the Beginning
Congratulations on your Lighthouse score of 100! That friendly green number can definitely make anyone's day. But while it's something to celebrate, let's take a step back and look at the bigger performance picture. We'll dive into how Lighthouse scores work differently from other tools, how these differences affect performance metrics, and why incorporating real-user monitoring is essential for a full understanding.
This blog post is generously supported by our friends at DebugBear, experts in optimizing web performance to enhance user experience. A big thank you to them!

The Joy of a Perfect Lighthouse Score
Ever found yourself obsessively tweaking a website, scanning for every possible improvement to shave off milliseconds of load time? If you've ever used Google Lighthouse in Chrome's DevTools, you're in familiar company. We've all hit that ecstatic moment when, after countless tests, we achieve a perfect 100 performance score.
Wouldn't it be nice to frame that score as definitive proof of success, maybe even angling for a pay raise with your boss? Well, hold on for a moment. While Lighthouse is a fantastic tool—a true cornerstone in web performance diagnostics—it doesn't tell the whole story of real-world user experiences on your site.

Why Lighthouse Is a Powerful Tool
It’s no secret: developers everywhere bask in the glow of a perfect Lighthouse score, sharing their achievements with pride. Lighthouse has become go-to software, mainly because it's so convenient. Just open DevTools, click on the Lighthouse tab, and voila—there's your report. It offers configurations for testing different speeds, and you can generate reports for mobile and desktop. Plus, if speed is your thing, Lighthouse is a bolt of lightning, offering results in just seconds.
To sum it up, there's a lot to love about Lighthouse:
- Convenient Access: A few clicks in DevTools, and you've got a report.
- Highly Configurable: Great for trying different troubleshooting scenarios.
- Fast Results: Get insights without the wait.
The Limitations: Lighthouse Isn’t the Complete Picture
While Lighthouse is excellent at what it does, it's crucial to understand its limits. Your 100 score might feel gratifying but doesn’t always match the real-world performance levels you (or your users) might encounter.

Simulated Data vs. Real User Data
Lighthouse uses simulated data to deliver quick results. This means it estimates load times and conditions rather than measuring actual user interactions. You might adjust settings to simulate a slow internet connection, for example, but ultimately, it's still a simulation, not a reflection of true user environments.
DebugBear's founder Matt Zeunert explains the nuances of simulated testing: "[Simulated throttling] reduces variability between tests. But if there’s a single slow render-blocking request that shares an origin with several fast responses, then Lighthouse will underestimate page load time."
In essence, simulated tests may speed up report generation but lack the accuracy of real-world data. Real-life user conditions often vary far more than a simulation can represent.

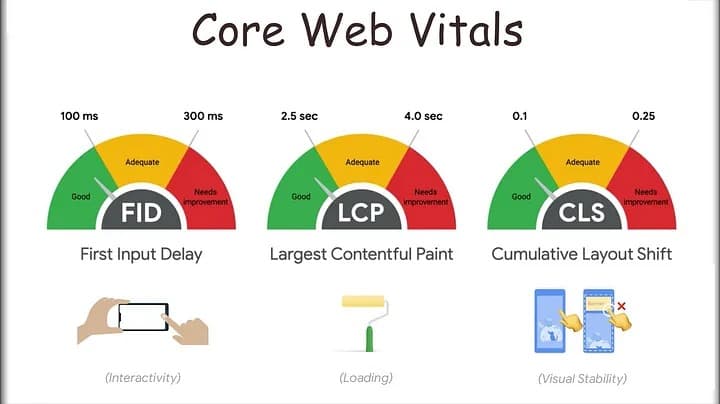
The Real Deal with Core Web Vitals
Core Web Vitals (CWV) are a set of metrics Google uses to measure more nuanced performance aspects—like how quickly the page becomes interactive or how stable the layout stays as it loads. Importantly, these metrics are built from real-user data collected in the Chrome User Experience Report (CrUX). This means they reflect true user interactions, unlike the synthetic data from Lighthouse.
So why does this matter? Real users often interact with the page in unpredictable ways, making metrics like Interaction to Next Paint (INP) and Cumulative Layout Shift (CLS) much more challenging for Lighthouse to measure accurately.
Lighthouse: A Great Starting Point
Lighthouse is a fantastic starting point for identifying performance issues quickly. Think of it as the initial gut check. Its rapid assessments can guide you in the right direction, but for deeper insights, data from real users paints a more vivid picture. Tools that incorporate CrUX data—and those that offer real-time monitoring—offer a broader glimpse into actual user experiences.
At the end of the day, integrating both simulated data from Lighthouse and real-user data can provide a comprehensive view of website performance. Real-time monitoring tools contribute fresh and dynamic insights that help fine-tune optimization strategies.
Embrace your Lighthouse success, but remember—it’s just one piece of the larger puzzle.